Pension Indicator Updated for August 31, 2019
It's Harvest Time, but how Good is our Crop?
By: Matthew Klein, Principal, Findley
School is back in session, football season is upon us, and it’s almost time to start harvesting this year’s crops. However, it appears a lack of “rain” will keep us from seeing a bountiful harvest.
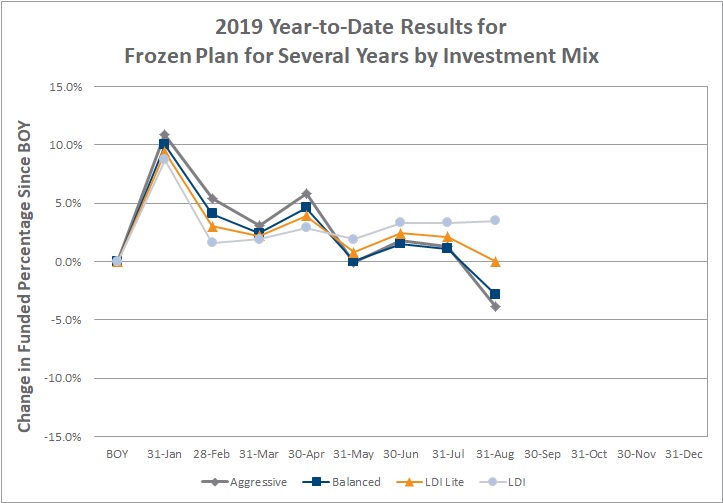
At the end of April, all of our year-to-date readings were still in positive territory. Unfortunately ever since planting season started, we’ve experienced less than ideal conditions. August saw the first time that the US 30-year Treasury closed under 2%i. The Moody’s Corporate Aa rate, a traditional bellwether for pension plans, closed under 3% at 2.96% on August 31st. There is no understatement here: these are the lowest long-term yields anyone alive has ever seen. Compared to the beginning of the year, long-term corporate bond yields have decreased over 100 basis pointsii. So while the S&P 500 index is still up double-digits percentage-wise, the drop in yields could increase pension liabilities from 15% to over 20%. As a result, the charts below show the precipitous drop in funded status.
While we still have four months left before the fiscal-year harvest, we will need a significant about-face for pension plans to finish in positive territory for the year.
As always, thanks for reading, and drop us a comment on how we're doing.
This email address is being protected from spambots. You need JavaScript enabled to view it. or Clearstead to discuss this information further.
For more information on the development of the Pension Indicator, please see our Disclosure document.
Information provided in this article is general in nature, is provided for informational purposes only, and should not be construed as investment advice. Performance data represents past performance. Past performance is not indicative of future results.
iUS Department of the Treasury
ii FTSE Pension Liability Index, as of 8/31/19
| Year to Date Investment Mix | ||||
|---|---|---|---|---|
| Plan Type | Growth | Balanced | LDI Lite | LDI |
| Frozen (for several years) | -3.9% | -2.8% | 0.0% | 3.5% |
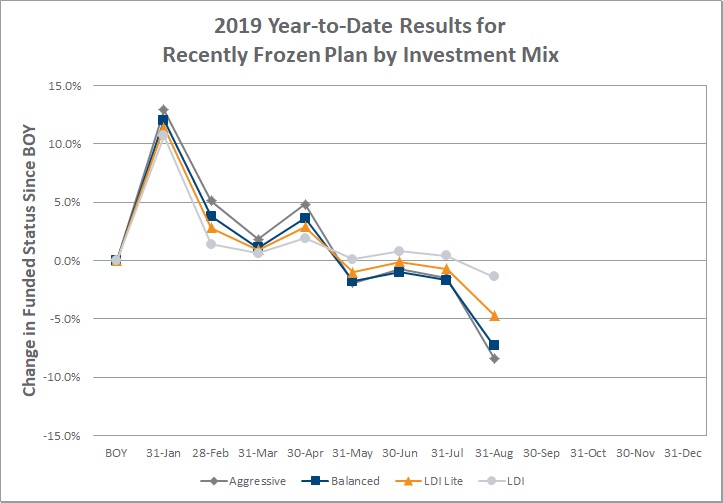
| Recently Frozen | -8.4% | -7.3% | -4.7% | -1.4% |
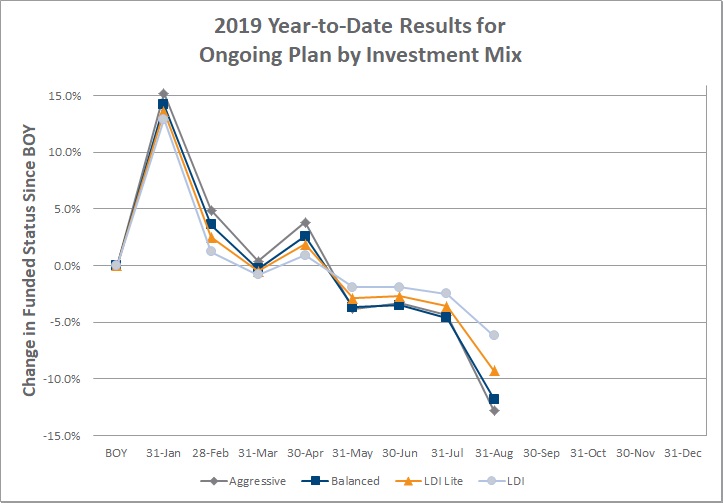
| Ongoing Traditional | -12.8% | -11.8% | -9.3% | -6.2% |
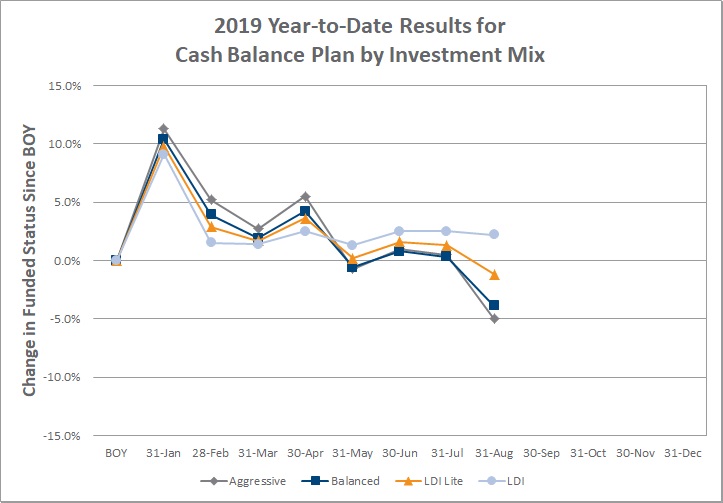
| Cash Balance | -5.0% | -3.9% | -1.2% | 2.2% |
| Month-over-Month Investment Mix | ||||
| Plan Type | Growth | Balanced | LDI Lite | LDI |
| Frozen (for several years) | -5.1% | -3.9% | -2.1% | 0.2% |
| Recently Frozen | -7.0% | -5.7% | -4.0% | -1.8% |
| Ongoing Traditional | -8.8% | -7.6% | -5.9% | -3.7% |
| Cash Balance | -5.5% | -4.2% | -2.5% | -0.2% |
| 12-Month Change Investment Mix | ||||
| Plan Type | Growth | Balanced | LDI Lite | LDI |
| Frozen (for several years) | -8.2% | -5.7% | -1.5% | 4.2% |
| Recently Frozen | -11.8% | -9.4% | -5.4% | 0.1% |
| Ongoing Traditional |
-15.4% | -13.1% | -9.3% | -4.0% |
| Cash Balance | -9.2% | -6.7% | -2.6% | 3.1% |