Pension Indicator Updated for June 30, 2024
Interest Rate and Stock Market Fireworks
By: Adam Russo, Assistant Vice President & Consulting Actuary, USICG
Welcome to the June 30, 2024 edition of the Pension Indicator. Matt Klein has decided to pursue other opportunities at a different firm. While we are all saddened by his departure, Plan Sponsors should be consoled by the facts below:
- The S&P 500 is up over 17% from the beginning of the year.1
- Corporate bond rates have increased over 50 basis points from the beginning of the year.1
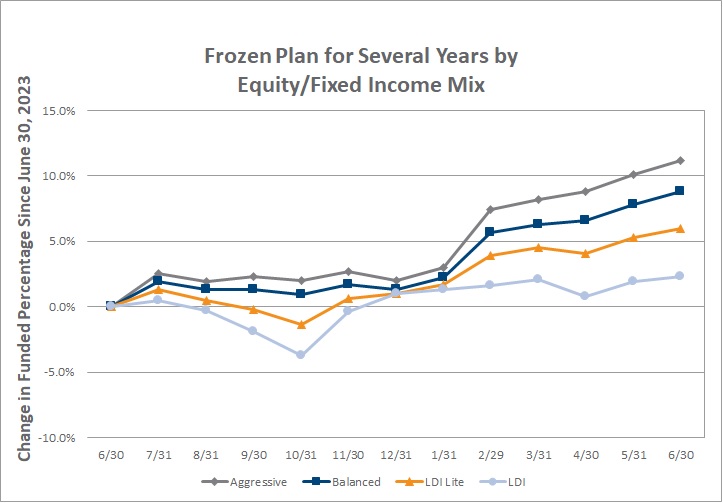
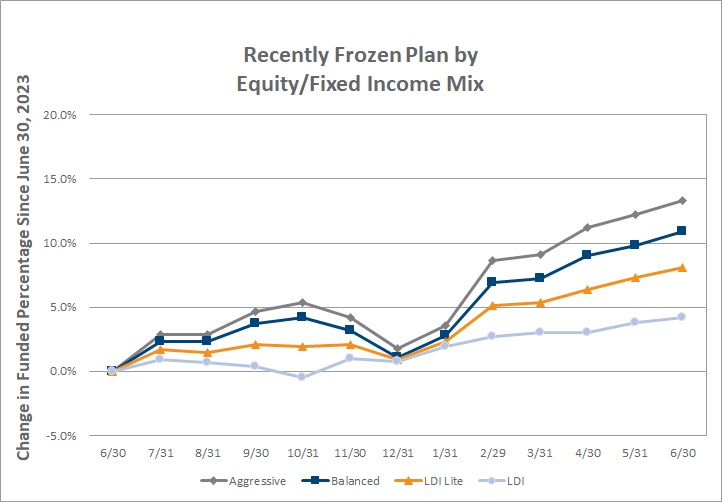
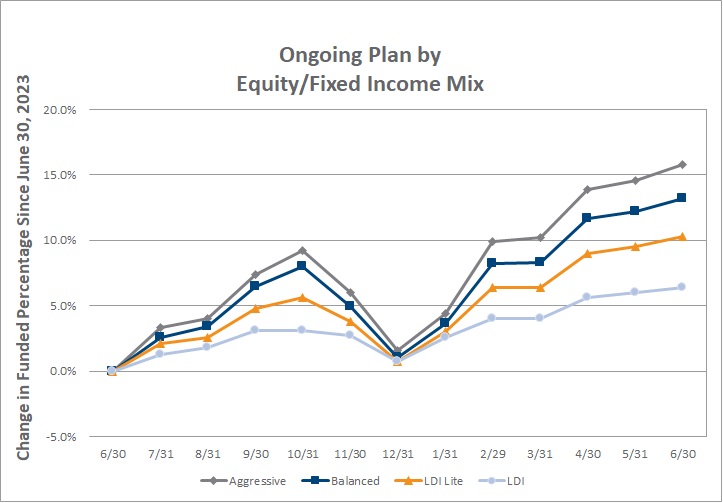
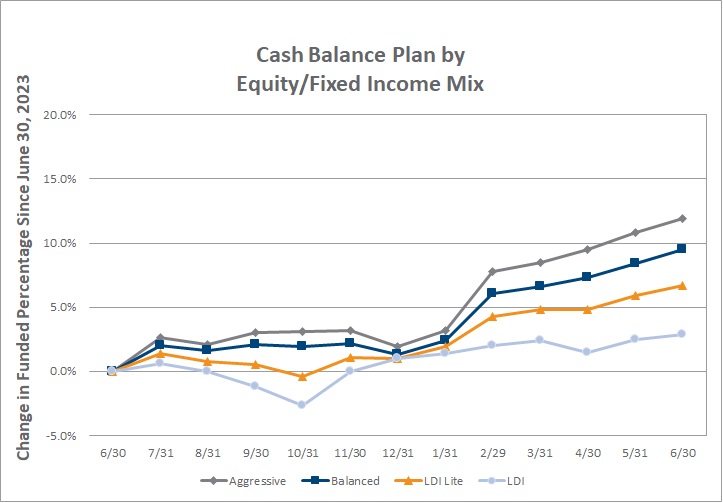
For Plans with a traditional or aggressive asset allocation mix, the combination above is the perfect storm to help improve Plan funded status by increasing market values and decreasing liabilities. We have seen some plans improve their funded percentage by as much as 7%-10% year-to-date. For Plans in an LDI allocation, the results, by design, have been more tempered.
Given the significant improvements many plans are seeing in their funding percentage, it may be time to start asking questions about what we should do next. There are a variety of de-risking strategies that companies can explore to take advantage of the current status of their pension plan. Both USI and Clearstead have expertise consulting on these strategies and guiding companies to make a decision that works best for their unique situation. Please contact us to learn more!
As always, thanks for reading, and leave us a comment on how we are doing or suggestions for improvement.
This email address is being protected from spambots. You need JavaScript enabled to view it. or Clearstead to discuss this information further.
For more information on the development of the Pension Indicator, please see our Disclosure document.
Information provided in this article is general in nature, is provided for informational purposes only, and should not be construed as investment advice. Performance data represents past performance. Past performance is not indicative of future results.
1Bloomberg
| Year to Date Investment Mix (Net) | ||||
|---|---|---|---|---|
| Plan Type | Growth | Balanced | LDI Lite | LDI |
| Frozen (for several years) | 9.2% | 7.5% | 5.0% | 1.4% |
| Recently Frozen | 11.2% | 9.5% | 7.0% | 3.3% |
| Ongoing Traditional | 13.5% | 11.8% | 9.2% | 5.4% |
| Cash Balance | 9.8% | 8.1% | 5.6% | 1.9% |
| Month-over-Month Investment Mix (Net) | ||||
| Plan Type | Growth | Balanced | LDI Lite | LDI |
| Frozen (for several years) | 1.0% | 0.9% | 0.7% | 0.4% |
| Recently Frozen | 1.0% | 0.9% | 0.7% | 0.4% |
| Ongoing Traditional | 1.0% | 0.9% | 0.7% | 0.4% |
| Cash Balance | 1.0% | 0.9% | 0.7% | 0.4% |
| 12-Month Change Investment Mix (Net) | ||||
| Plan Type | Growth | Balanced | LDI Lite | LDI |
| Frozen (for several years) | 14.1% | 11.7% | 8.8% | 5.0% |
| Recently Frozen | 16.2% | 13.7% | 10.8% | 6.9% |
| Ongoing Traditional |
18.6% | 16.0% | 13.0% | 9.0% |
| Cash Balance | 14.8% | 12.3% | 9.4% | 5.5% |
Please click on the "Historical" tab at the top of the website for longer time periods, including Five-Year and Return Since Inception (1/1/2016).